wagh311
import os
import numpy as np
import matplotlib.pyplot as plt
import pandas as pd
from statsmodels.nonparametric.smoothers_lowess import lowess
def loess_smooth(data, frac=0.035):
x = np.arange(len(data))
smooth_result = lowess(data, x, frac=frac)
return smooth_result[:, 1]
# 生成示例数据
environments = ["HalfCheetah-v2", "Hopper-v2", "Swimmer-v2", "Walker2d-v2"]
algorithms = ["PPO", "SAC", "DPPO"]
# 设置文件路径列表
file_paths = {
"HalfCheetah-v2": ['Half1.csv', 'Half2.csv', 'Half3.csv'], # 例如:Half.csv中包含seed1,seed2,seed3三列数据(奖励)
"Hopper-v2": ['Hopper1.csv', 'Hopper2.csv', 'Hopper3.csv'],
"Swimmer-v2": ['Swimmer1.csv', 'Swimme2.csv', 'Swimmer3.csv'],
"Walker2d-v2": ['Walker1.csv', 'Walker2.csv', 'Walker3.csv']
}
# 创建一个2x2的子图布局
fig, axs = plt.subplots(2, 2, figsize=(12, 8))
# 创建颜色映射
color_map = {alg: plt.cm.tab10(i) for i, alg in enumerate(algorithms)}
# 模拟一些数据,以便演示
for i, env in enumerate(environments):
ax = axs[i // 2, i % 2]
# 存储当前环境的算法标签
env_handles = []
env_labels = []
for file_path, algorithm in zip(file_paths[env], algorithms):
df = pd.read_csv(file_path)
reward_data = [df[col].tolist() for col in df.columns]
mean_rewards = np.mean(reward_data, axis=0)
std_rewards = np.std(reward_data, axis=0)
# 对均值进行Loess平滑处理
smoothed_mean_rewards = loess_smooth(mean_rewards, frac=0.035)
# 对标准差进行Loess平滑处理
smoothed_std_rewards = loess_smooth(std_rewards, frac=0.035)
# 特殊处理 PPO 的颜色
if algorithm == "PPO":
color = 'orange'
else:
color = color_map[algorithm]
# 绘制平滑处理后的奖励函数图
line, = ax.plot(smoothed_mean_rewards, label=f'{algorithm}', alpha=0.8, color=color)
ax.fill_between(range(len(smoothed_mean_rewards)), smoothed_mean_rewards - smoothed_std_rewards,
smoothed_mean_rewards + smoothed_std_rewards, alpha=0.2, color=color)
# 存储当前算法的标签和线条
env_handles.append(line)
env_labels.append(f'{algorithm}')
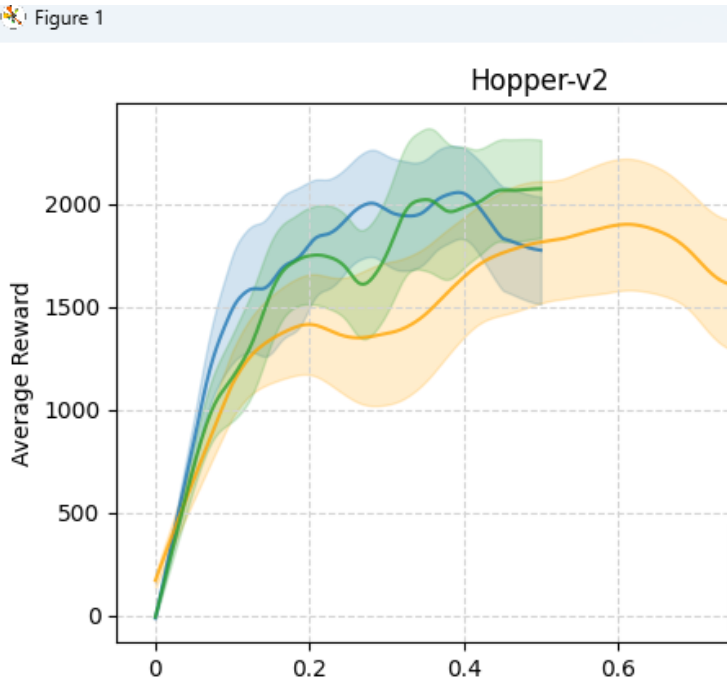
ax.set_title(f"{env}")
ax.set_xlabel('Time Steps(1e6)')
ax.set_ylabel('Average Reward')
# 在当前子图中手动创建图例
ax.legend(handles=env_handles, labels=env_labels, loc='lower right')
# 添加浅灰色虚线网格线
ax.grid(True, linestyle='--', color='lightgrey')
# # 修改横坐标
labels=["0",'0','0.2','0.4','0.6','0.8','1M']
# total_steps = len(smoothed_mean_rewards) # 获取总步数
# steps_in_millions = np.linspace(0, total_steps - 1, 6) / 1e6 # 将总步数分割为6个点
ax.set_xticklabels(labels)
# 调整布局以防止标题重叠
plt.tight_layout()
# 保存图为PDF文件(dpi=600)
plt.savefig('multi-result.pdf', format='pdf', dpi=600)
# 显示图形
plt.show()